$20 Bonus + 25% OFF CLAIM OFFER
Place Your Order With Us Today And Go Stress-Free
This assignment will help you to be able to evaluate the performance of a company through a critical analysis of the company's published financial statements.
Research and use published financial data for the past four years from a company of your choosing and compose a thorough analysis of the company's operations and performance health.
You are a financial consultant who has been asked to analyse the financial statements and annual reports of a corporation. You must include the following statements in your analysis:
Balance Sheet
Income Statement
Cash Flow Statement
Liquidity
Leverage
Profitability
Create a performance evaluation by analyzing the following performance measures:
Profitability
Efficiency
Short-term Solvency
Long-term Solvency
Market-based Ratios
Suggest recommendations for improving the company business based of your report and research.
Recommend one new investment project to the company. The company wants to expand its business through an investment project, however, it can only capitalize 40% through own capital.
Indicate whether it is a good idea by using NPV and WACC.
Indicate whether the company must use its own cash or use retained earnings.
Decide whether or not the company should pay return earnings or not.
Companies are expected to present financial information to stakeholders, particularly shareholders. Accordingly, companies release one-year financial statements that include the company's economic facts. With these financial statements, investors forecast a company's future profitability and viability while management develops a plan. This article seeks to identify a company's economic outcomes by thoroughly examining its stated reports. ARAMCO is a company situated in Dhahran, Saudi Arabia, and has been chosen for evaluation.
A complete performance review of ARAMCO will be performed in this study, including its profitability, efficiency, short-term solvency, long-term solvency, and market-based indicators. ARAMCO’s' financial statements for the five years, i.e., 2017,2018,2019, 2020 and 2021, have been analyzed for this purpose. New investment suggestions would be made based on the performance analysis for further business expansion. In addition, investment techniques like NPV(Net Present Value) and Weighted Average Cost of Capital(WACC) would be considered further for investment analysis and recommendations.
The overall significance of the financial figures from the balance sheet and income statement are given below (All numbers are in thousands in SAR):
|
Particulars |
2017 |
2018 |
2019 |
2020 |
2021 |
|
Current Assets |
67,521 |
1,02,042 |
1,08,853 |
1,06,368 |
1,35,825 |
|
Current Liabilities |
39,747 |
48,990 |
57,486 |
64,857 |
80,950 |
|
Inventory |
9,070 |
1,621 |
11,362 |
13,867 |
17,027 |
|
Cash |
21,665 |
48,841 |
47,388 |
55,262 |
67,625 |
|
Total Assets |
2,94,014 |
3,58,978 |
3,98,434 |
5,10,470 |
5,45,819 |
|
Total Equity |
2,20,350 |
2,74,249 |
2,78,996 |
2,93,625 |
3,17,171 |
|
Long Term Debt |
33,917 |
35,739 |
61,952 |
1,51,988 |
1,47,698 |
|
EBIT |
1,55,050 |
2,12,772 |
1,77,798 |
99,313 |
47,647 |
|
Interest |
557 |
789 |
1,607 |
2,817 |
923 |
|
Depreciation |
9,913 |
11,023 |
13,404 |
20,322 |
5,573 |
|
COGS |
1,08,732 |
1,43,032 |
1,49,843 |
1,27,662 |
45,556 |
|
Average Inventory |
5,346 |
6,492 |
12,615 |
15,447 |
13,808 |
|
Sales |
2,64,176 |
3,55,940 |
3,29,809 |
2,29,891 |
93,320 |
|
Accounts Receivables |
23,171 |
25,018 |
24,940 |
22,715 |
33,401 |
|
Net Fixed Assets |
2,00,302 |
2,33,021 |
2,61,870 |
3,22,523 |
3,27,229 |
|
Inventory Turnover |
20.34 |
22.03 |
11.88 |
8.26 |
3.30 |
|
Average A/R |
24,095 |
24,979 |
23,828 |
28,058 |
16,701 |
|
A/R Turnover |
10.96 |
14.25 |
13.84 |
8.19 |
5.59 |
|
Net Income |
75,898 |
11,071 |
88,185 |
49,003 |
25,458 |
|
Price per share |
8.90 |
10.00 |
9.47 |
9.56 |
10.00 |
The performance evaluation of ARAMCO is conducted by considering various financial ratios over the last five years, i.e. from 2017 to 2021.
| Profitability Ratios | 2017 | 2018 | 2019 | 2020 | 2021 |
| Profit margin | 0.29 | 0.03 | 0.27 | 0.21 | 0.27 |
| Return on assets (ROA) | 0.258 | 0.031 | 0.221 | 0.096 | 0.047 |
| Return on equity (ROE) | 0.3444 | 0.0404 | 0.3161 | 0.1669 | 0.0803 |
Overall Profitability ratios decline by more than 50%. The profit margin ratio of ARAMCO declined by 5% compared in 2021 compared to 2017. Although there is no scale to measure the good or lousy profit margin, the company is considered profitable if the margin is somewhere between 5% to 10% (Periyathampy et al., 2003).
The return on asset ratio has declined since 2019, meaning the company cannot manage its assets effectively, especially post-pandemic. ROE has reduced by over 77% in 2021, which means the company, although it tried to use the shareholder’s fund effectively, improved in 2019 but declined by 2021.
Although the ideal profitability ratio ranges between 15% to 20%, the company could not reach that level; the primary reason could be the economic downturn because of the COVID-19 pandemic.
The graph below shows the trend of efficiency ratios from 2017 to 2021.

There has been a consistent decline in efficiency ratios over the last five years. The inventory turnover ratio has declined, so the company needed help managing its inventory effectively. The Asset turnover ratio in 2021 was 0.171, the lowest in the last 5 years. Ideally, the Asset turnover ratio should be 1 or more than 1. However, it was less than .5, meaning the company has been struggling to manage its assets effectively.
There has been a considerable decline in the Receivable turnover ratios, which is a 75% decline from 2017. It indicates that the company still needs to meet the credit sale requirement in 2021, which has been the lowest in the last 5 years. The company is performing well, but it is essential that the receivable turnover ratio increase in the future to avoid any bad debts.
The short-term solvency ratio consists of the current, quick, inventory turnover, and accounts receivable ratios. Short-term solvency ratios helps to identify the company’s liquidity performance in the short period of one year. The table and graph given below show the short-term solvency of the company:
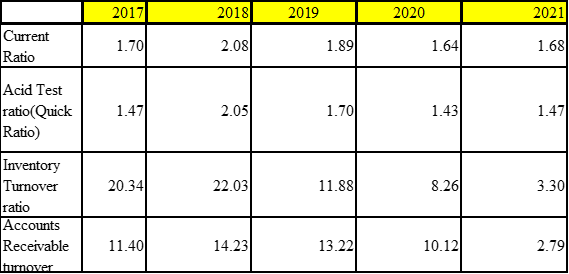

The current ratio of ARAMCO has reduced by 1% from 2017 to 2021, which means that the company is in little distress. The quick ratio is consistent and the same as in 2017, although it was highest in 2018.
Since the quick ratio is higher than 1, it can be concluded that the company is liquid enough to meet its urgent requirements. However, the overall outlook of short-term solvency is unfavourable an investor’s perspective because of the fall in overall short-term solvency ratio, which indicates a risky investment.
Also Read - Financial Accounting Assignment Help
The firm’s long-term solvency is measured in the debt-to-equity ratio. The graph and the table given below shows that there has been 67% increase in long-term solvency, which indicates that it is risky for the creditors. The debt-to-equity ratio here is high, which clearly indicates that the company has been borrowing higher amounts from the creditors in order to fund its operations.
Because certain sectors employ more debt financing than others, each industry has its own debt to equity ratio standard. A debt ratio of 0.5 ?? indicates that there are half as many obligations as there are assets. In other words, the company's assets are funded 2-to-1 by investors vs debtors. However, in this case, the debt ratio to the equity is more than 50%, increasing the risks for the creditors.
The oil and gas industry's ideal debt-to-equity ratio varies between 2 to 2.5, where here it is less than 1, which is good compared to the industry statistics. However, from the company and for the creditors perspective, it may be risky.
In addition, the debt to equity has been higher, entailing that the investors are not investing in the company because they feel higher debt financing will reduce the net income as the interest on debt would increase, resulting in lower cash flows. It also indicates that it will result in higher leverage ratio, resulting in increasing the company’s financial risk resulting in smaller equity base.
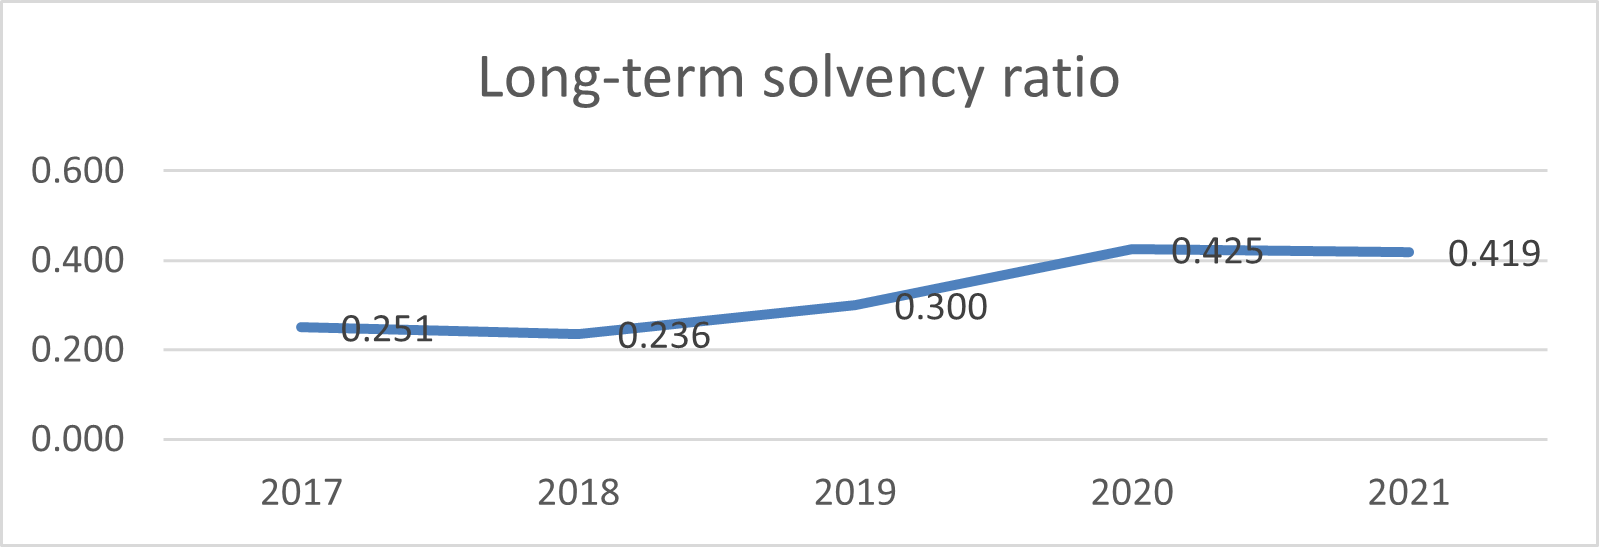
From the table given below, it is evident that the long-term solvency ratio has increased by 67%, which is a good sign for the company.
| 2017 | 2018 | 2019 | 2020 | 2021 | Increase/Decrease | |
| Debt to Equity Ratio | 0.251 | 0.236 | 0.300 | 0.425 | 0.419 | 67% |
The market-based ratios generally help to determine the mark company’s market capitalization and help to determine its position in the market. Given below are statistics of the market-based ratios of ARAMCO:
| Market-based ratios | 2017 | 2018 | 2019 | 2020 | 2021 | Increase/decrease |
| Earnings per share | 3.32 | 2.5 | 0.44 | 0.25 | 1.55 | -53% |
| PE Ratio | 2.68 | 4 | 21.52 | 38.24 | 6.45 | 141% |
Here, two ratios are considered for obtaining the market value- EPS and PE ratio. Earnings per share are equivalent to any profitability or market potential ratio. A higher ratio is usually preferable to a lower ratio since it indicates that the firm is more lucrative and has more money to give to its shareholders.
Although many investors ignore the EPS, a greater earnings per share ratio generally causes a company's stock price to grow. Because so many factors may impact this ratio, investors look at it but don't allow it much influence their judgements.
The price-to-earnings ratio predicts the value of a stock based on its earnings. As a company's profits per share grow, so will its market value per share. A firm with a high P/E ratio typically indicates that it will do well in the future, and investors are ready to pay more for its stock.
A smaller ratio, on the other hand, is typically indicative of poor present and future performance. This might turn out to be a bad investment for future . The earnings per share declined by 53% in 2021, according to 2017. However, the Price to earning ratio has increased by 141%.
Although the EPS has increased from 2019 to 2021, maybe because of the pandemic, the overall PE ratio declined from 38.24 to 6.45, which means investors are willing to invest less in the company’s shares.
However, the company’s performance was far better in 2019 and 2020. On the other hand, the EPS has increased, which means the investors have started believing that the company may begin performing well after the pandemic.
Also Read - Finance Assignment Help
After examining ARAMCO’s financial ratio analysis, the following are some observations and recommendations the company can follow to enhance its performance.
Profitability ratios: under the profitability ratios, it has been observed that the company’s profit margin ratio has just declined by 5% from 2017, indicating that the company should increase prices to enhance its gross profit margin.
Bulk discounts should be provided to the vendors to improve profitability. Also, it is recommended to develop and use an effective inventory system. The company should focus on enhancing revenues and reducing costs to improve the net profit margin. Every business strives to increase its net margin. If a company's net margin is higher than the industry average, it has a strategic advantage over other companies engaged in equivalent operations (Chakravarty, 1999).
Return on Assets can be one of the most critical actions for managing the majority of the large corporation is increased or retained asset appreciation. This is due to the involvement of most owners, potential investors, boards of directors, management teams, and employees in these proportions. However, shareholders are the key players who pay attention to the return on assets (Alsyouf, 2007). Higher ROA results in effective management of the funds. Return on Assets can be managed effectively if the company improves its current and fixed assets or decreases the total assets.
Return on investment is another factor that determines the profitability of the company. The company can manage its finance which can be done effectively if it focuses on the compounded interest investment, concentrate mainly on research-based products, and identify the overly or unnecessary expenses and reduce them.
Efficiency ratios: As discussed above, the company’s efficiency ratio declined over the last 5 years. The company needs to manage its inventory and receivables ratios effectively, which means it has to focus more on improving the cash flow, and it should set a smooth sales process. When earnings are maximized, sales are more inventive and adaptable (Lee et al., 2015). The sales process can be further improved by introducing process automation, revising the business pricing strategies, optimizing the supply chain, reducing expenses and saving energy by managing time effectively.
Short-term solvency ratio: The company's short-term solvency ratio was favourable regarding the current balance and quick ratio management. The company has maintained the same liquidity regarding the management of existing assets. However, the inventory turnover and accounts receivable ratios still need improvement. The short-term solvency can increase by paying off the current liabilities, enhancing the shareholders’ fund by improving the currently improved assets, selling non-productive assets and faster conversion of receivables.
Long-term solvency ratio: The company’s debt-to-equity percentage has considerably increased, although it declined from last year. Companies may take action to both increase and decrease their debt-to-capital ratios. Approaches that can be used include enhanced asset management, increased competitiveness, and debt consolidation (Doff, 2008). They are combined with the growth in the cost of their goods or services if the pricing strategy is sound. Nevertheless, the company can still increase its long-term solvency by enhancing revenues, managing its inventory effectively and restructuring its long-term debts.
Market-based ratios: ARAMCO’s market-based ratios have been the EPS and PE ratio. While the EPS has declined over the last 5 years, the PE ratio has increased by more than 100%. The company should start attracting new investors to enhance its market capitalization. ARAMCO should also focus on maintaining high-profit margins and robust marketing strategies to increase its sales in the market. The company should focus on attracting more investors by enhancing its earnings, as it will ultimately benefit the shareholders, thus, resulting in a higher valuation of the company later.
Also Read - Management Assignment Help
The company has been planning to invest in a new project by expanding, so it can make investment by establishing its business operations in other country in Asian countries like India, where the demand for oil is higher and it also provides lucrative offers for the Foreign Direct Investment.
ARAMCO has seen a considerable increase in this competitive environment and has grown its business in Saudi Arabia and the international market. The company has outgrown its challenges and has succeeded by collaborating with other companies. As a result, the company has become global, entered a new market, and launched many new products. The company has constantly been expanding with numerous collaborations with new and established business organizations worldwide.
However, to improve the company’s performance, it is always essential whether it should focus on investing in the new project or continue with the current performance.
Considering the total investment in the new project is SAR50,00,00,000 (500 million) then, in that case, the total value based on the Net Present Value method is represented in the table below:
| WACC | 10% | PV | PV of CF |
| 0 | SAR-50,00,00,000.00 | SAR -50,00,00,000.00 | |
| 1 | SAR 5,00,00,000.00 | SAR 4,54,54,545.45 | |
| 2 | SAR 5,00,00,000.00 | SAR 4,13,22,314.05 | |
| 3 | SAR 40,00,00,000.00 | SAR 30,05,25,920.36 | |
| 4 | SAR 10,00,00,000.00 | SAR 6,83,01,345.54 | |
| 5 | SAR 10,00,00,000.00 | SAR 6,20,92,132.31 | |
| Sum PV | SAR 1,76,96,257.71 |
Here, the WACC rate is considered 10%. The total cash outflow is calculated based on the 10% of the Average Working Cost of Capital. The Average Working Cost of Capital (WACC), which includes ordinary stock, preferred stock, bonds, and other types of debt, is the average after-tax cost of capital for a company. WACC is calculated by using the given formula
WACC=(VE×Re)+(VD×Rd×(1-Tc))
Where,
E= Market value of the firm’s equity
D=Market value of the firm’s debt
V=E+D
Re=Cost of equity
Rd=Cost of debt
Tc=Corporate tax rate
The corporate tax rate in Saudi Arabia is 20%, which is considered here. Here the Cost of equity is 7.5% (Good, 2023) and Cost of Debt is 5.8% ( (Good, 2023).
Calculating the WACC of the company by using above formula, we get:
(VE×Re)+(VD×Rd×(1-Tc))
[{(3,17,171/4,64,869)x 7.5%)}+ {(1,47,698/4,64,869)x 5.8%} x (1-20%)]
= 6.59 %%
The WACC is the typical interest rate a business anticipates paying to finance its assets. The WACC rate here is 6.59% as compared to the NPV rate of 10% which is lower. However, higher WACC may result in higher outflow of cash in future, and the lower rate may result in lower cash outflows. As the cash flow may fluctuate over the years, the outflow may be affected hence, NPV should be considered over the WACC.
Here, if the company decides to invest the amount of SAR50,00,00,000 on the new project, then the net present value at the rate of 10% is positive, which is SAR1,76,96,257.71, which means the project is going to be positive and hence, it can very well invest in the project for the next five years.
To consider whether the company should focus on evaluating the NPV method or the WACC method, the company should consider the NPV method over the WACC.
Corporate managers frequently assess the profitability of various organizations by estimating NPV. It is predicated on the idea that today's money is less valuable than what is now in the bank. The essential characteristic of the NPV is the capitalization on future cash flows to present values.
The NPV method generates a monetary value that represents the value of the company's venture. Shareholders can examine how a project affects the company’s value (Schwab & Lusztig, 1969). The discount rate of a company's capital investment is taken into account in the NPV calculation. This is the typical return on investment for shareholder investments in the business.
To consider whether the company should focus on WACC and NPV or depend on its cash or retained earnings, the company should try to invest and check the feasibility of investing in the new project as it is showing a positive sign. It will also provide a positive result after five years.
Here are some advantages of using the NPV over the cash or retained earnings because NPV considers the future values of the cash flows and indicates that it is higher than the present values of the cash flows.
It should also be assumed that the net present worth also considers the risk factors, which are not considered while investing the current cash or making further investments through retained earnings. It should also be assumed that the NPV method also considers the cost of capital and the relevant risk factors associated with the project.
The Net Present value can also help determine the value of the results; however, the same cannot be possible with the current cash or retained earnings. The Net Present Value method also considers the total cash flows associated with future cash flows. In addition, the NPV ratio is easy to understand and relatively simple, as seen from the investors’ perspective.
Moreover, the WACC is the cost of the capital where the Interest expenditure is traditionally borne by debt capital.
In contrast, equity capital takes the opportunity cost of lost capital gains to outside investors. As a result, calculating the WACC is critical to examine proposed business initiatives for financial viability. Moreover, all else being equal, as interest rates rise, the WACC increases because its debt and equity components climb.
As against this, the retained earnings have a cost involved in its investment, as they are the profits that stay in your company after all expenditures have been paid and all payouts to shareholders have been made. Therefore, when deciding whether to invest in a firm, investors frequently consider its retention ratio.
The retention ratio is the percentage of net profits held in retained earnings by the firm. The retained earnings should be around the company’s profitability. Hence, in this case, the company should consider the remaining 40% of the total amount of retained earnings or cash. In this case, the retained earnings of the company based on its capital can be calculated as below:
If considering whether to consider the capital or the earnings for the given situations, the calculation given below will give a better idea as to what to consider for the same :
Capital of Company = $ 1,57,69,87,000
40% of Capital = $ 63,07,94,800
Retained Earnings = $ 94,61,92,200
From the table, it is clear that the company’s total capital in 2021 was $ 1,57,69,87,000 and 40% of the total amount is still higher than the retained earnings, which the money should be considered over the retained earnings as the amount is higher than the returned earnings.
However, retained earnings are preferred because they belong to the shareholders as they own them. Hence, retained earnings can be considered one of the company’s investment options, but the shareholders own them. Hence, they should be considered after the consideration of other options.
Also Read - Corporate Strategy Assignment Help
Dividends are company profits distributed to shareholders. They might be in the form of cash, stock shares, or other property payments. Dividends can be paid out in a variety of timeframes and amounts. Traditionally, corporations do not pay dividends since it is more economically prudent to reinvest funds in assets during critical development times. However, even well-established businesses frequently reinvest their profits to fund new ventures, buy other companies, or pay off debts. All of this action raises the share price.
Considering the statistics of ARAMCO, it is evident that the dividend of the company in 2020 was SAR 75,015 compared to that SAR 69,649 in 2020. The amount of dividend has increased over the last two years post the pandemic, which indicates that the performance of the company is rising; thus, it should consider reinvesting the dividend amount in the company’s projects rather than distributing dividends to the shareholders as it will be practical and helpful to increase the company’s performance further in future.
As shown by the ratios, there is a plethora of opportunities for improvement, so the company should invest in those activities so that they can deal with problems and improve their performance, which will increase the company's share value and old and new investors will invest in the organization and the firm will generate more profits, increasing the shareholders' dividend.
ARAMCO should distribute withheld earnings to its shareholders. The company must optimize overall shareholder return by paying steady and rising dividends, maintaining free cash flow growth, and investing in long-term value-creating opportunities. The corporation was also above analysts' expectations with a considerably higher profit. This is the most money the company has made in a quarter since going public in 2019.
In addition, the accounts receivable and working capital ratios have remained constant throughout the company's existence. This indicates that the company can pay its suppliers' invoices on time and collect those payments.
Also Read - Managerial Accounting Assignment Help
ARAMCO’s financial ratios research reveals that the corporation has much space for development. However, the study is not favourable because its revenue is declining, and its capacity to service its debt is also declining. Furthermore, the company faces a significant chance of default. So the organization should evaluate these problems since they are problematic for investors, and with little or no investment, the firm may suffer liquidity issues. ARAMCO should also consider investing its dividends in maintaining healthy functioning smoothly; otherwise, it will soon suffer a disaster.
A major huddle for the company was during the period of the pandemic. However, the industry overall took a hit because of the economic downturn; hence, it should be noted that the company needs to focus primarily on expansion to other countries because it is already facing higher challenges in the domestic market because of the increase in the competition. Furthermore, as discussed, the new investment for the next five years will be more profitable, and hence, the company should focus more on expanding to the south Asian countries as well, as there is a higher demand for the products.
With the wide variety of products, ARAMCO can very well strategize the marketing strategy for each product, which can ultimately help in the enhancing the profitability for other products. The company should also spend some amount in the products research and development, which could further help in improvising the products along with cost reduction objective, ultimately increasing the profitability of the company. The new product lines or improved product lines can also attract new investors, increasing the market capitalization ultimately.
ARAMCO. (2023, Jan 21). Company Financial Summary. Retrieved from ARAMCO: https://www.aramco.com/en/investors/investors/company-financial-summary
ARAMCO. (2023, Jan 21). Saudi Aramco Annual Report 2021. Retrieved from ARAMCO: https://www.aramco.com/-/media/publications/corporate-reports/saudi-aramco-ara-2021-english.pdf?la=en&hash=8AD6C7CC2E32AE17A641FA558060215BE7EB22DD
Carlson, R. (2022, Nov 29). Net Present Value (NPV) As a Capital Budgeting Method. Retrieved from The Balance: https://www.thebalancemoney.com/net-present-value-npv-as-a-capital-budgeting-method-392915
Chakravorty, A. A. (2010). Profit margin, process improvement and capacity decisions in global manufacturing. International Journal of Production Research, 37,1999(18), 4235-4257. doi:https://doi.org/10.1080/002075499189754
Clements, J. (2017, Sep 26). What Is the Relationship Between Interest Rates, NPV and IRR? Retrieved from Bizflunt: https://bizfluent.com/info-12036641-relationship-between-interest-rates-npv-irr.html
Doff, R. (2008). A Critical Analysis of the Solvency II Proposals. The Geneva Papers on Risk and Insurance - Issues and Practice, 33, 193-206.
Good, A. (2023, Feb 13). What's Saudi Aramco Worth? Retrieved from Morning Star: https://www.morningstar.com/articles/959024/whats-saudi-aramco-worth
Johnson, B. (2022, May 31). What Is Retained Earnings? How to Calculate Them. Retrieved from Legal Zoom: https://www.legalzoom.com/articles/what-is-retained-earnings-how-to-calculate-them
Lee, Y. L., & Lee, M. J. (2016, Sep 19). Rush to Take Advantage of a Dull iPhone Started Samsung's Battery Crisis. Retrieved from Bloomberg: https://www.bloomberg.com/news/articles/2016-09-18/samsung-crisis-began-in-rush-to-capitalize-on-uninspiring-iphone
Schwab, B., & Lusztig, P. (1969). A Comparative Analysis Of The Net Present Value And The Benefit-Cost Ratio As Measures Of The Economic Desirability Of Investments. The Journal of Finance, 24(3), 507-516.
WSJ. (2023, Jan 21). Saudi Arabian Oil Co. Retrieved from WSJ: https://www.wsj.com/market-data/quotes/SA/XSAU/2222/financials/annual/balance-sheet
Yahoo Finance. (2023, Jan 21). Saudi Arabian Oil Company (2222.SR). Retrieved from Yahoo Finance: https://finance.yahoo.com/quote/2222.SR/balance-sheet?p=2222.SR
Are you confident that you will achieve the grade? Our best Expert will help you improve your grade
Order Now


Subscribe to avail our special offers
Disclaimer: The reference papers given by DigiAssignmentHelp.com serve as model papers for students and are not to be presented as it is.
These papers are intended to be used for reference & research purposes only.
Copyright © 2026 DigiAssignmentHelp.com.
All rights reserved.
Powered by Vide Technologies
100% Secure Payment