$20 Bonus + 25% OFF CLAIM OFFER
Place Your Order With Us Today And Go Stress-Free
This assignment aims to allow you to gain experience and thus show you can apply the important ideas of this unit: i.e. recognising that many resources relied upon for business success are not accounting assets; recognising the non-economic types of value produced (or destroyed) by companies; being able to use the DES method to analyse trends; checking whether accounting signals have connection to real world explanations; and understanding that companies can account for the same thing in different ways.
The format of the assignment comprises simply a response to each of four requirements. Thus, the assignment is not a report: thus Introductions, Executive Overviews and Tables of Contents are NOT wanted.
The subject of this assignment is the use of resources by companies to create value. The first Requirement therefore explores the resources used by your pair of companies and the forms of value they create. Accounting measures this with the ratio ‘Return on Assets’.
Thus Requirement 2 concerns analyses of ROA trends so that the performance of the pair of companies can be compared and judged. However, the analyses in Requirement 2 ignore the measurement limitations of accounting information: the fact that companies may choose different accounting policies or different bases for estimates when measuring profit and assets.
Therefore Requirement 3 explores differences between companies in this respect and to consider how these differences should affect the judgement made in Requirement 2.
It is not practicable in this assignment to take a quantitative approach to considering how the differences should affect the judgement in Requirement 2 and thus the re-consideration of how the companies compare is qualitative only.
Finally, Requirement 4 summarises how accounting representation of the resources and value described in Requirement 1 is limited, together with the ways accounting’s measurement is limited (you may use outcomes from Requirement 3 as examples), when this information is being used to compare how well your pair of companies use their resources to create value.
Thus, you must answer each of the following four requirements in sequence:
1. Compare and contrast the main resources of the two companies that are critical to the generation of value for shareholders and other stakeholders, e.g. the resources make a big difference to competitiveness of services or create non-economic forms of value;
2. Using accounting data from the Morningstar reports, evaluate and compare the two companies’ Return on Asset (ROA) performances for the years ending 2020, 2021 and 2022;
3. Identify three instances in the 2022 financial statements where the accounting treatments of items that affect the measurement of ROA differ between the two companies and discuss how these differences might affect the comparison of ROA performances in Requirement 2;
4. With reference to Requirement 1, discuss the limitations of accounting information in assisting decisions about how well your pair of companies use their resources to generate value.
Moreover, each of the four requirements comprise multiple parts (performance indicators) as shown in the marking rubric below. You must make clear your response to each indicator by structuring your work around the performance indicators for each requirement. If you have not responded to a performance indicator, insert “not answered”.
Apple Inc and Microsoft are the two organizations taken into consideration for this study to extrapolate the manner in which these firms alleviate value for their respective shareholders. Apart from that, the study also entails along an appraisal and intricate assessment of their financial performance by scrutinizing their ratio analysis.
The resources deployed by both Apple Inc. as well as Microsoft, are not only distinct but also complementary in nature as far as generating value for shareholders and stakeholders is concerned. Simply put, the primary strength of Apple hinges upon its proprietary ecosystem, which revolves around hardware such as iPhones, Macs, and wearables.
The characteristic attribute of this closed ecosystem is that it assists in augmenting the customer loyalty, thereby fostering a unique user experience that is potent enough to propel the revenue flow through a diverse product portfolio. On the contrary, Microsoft's core resources entail software,coupled with cloud services.
The contribution of its Windows operating system, Office suite, as well as Azure cloud platform are simply unequivocal in serving businesses at a global scale. Microsoft's concentration on enterprise solutionsand cloud computing solitarily converges towards a diversified revenue stream (Sarwar et al., 2021).
Also Read - Finance Assignment Help
| Data | 2020 | 2021 | 2022 |
| EBIT | 66288000 | 108949000 | 119437000 |
| Average assets | 323888000 | 351002000 | 352755000 |
| Operating revenue | 394328000 | 365817000 | 394328000 |
| Ratios: | 2020 | 2021 | 2022 |
| EBIT / Average assets (A/B) | 0.2047 | 0.3104 | 0.3386 |
| (A): EBIT | 66288000 | 108949000 | 119437000 |
| (B): Average assets | 323888000 | 351002000 | 352755000 |
| EBIT/ Operating revenue (A/B) | 0.1681 | 0.2978 | 0.3029 |
| (A): EBIT | 66288000 | 108949000 | 119437000 |
| (B): Operating revenue | 394328000 | 365817000 | 394328000 |
| Operating revenue / Average assets (A/B) | 1.2175 | 1.0422 | 1.1179 |
| (A): Operating revenue | 394328000 | 365817000 | 394328000 |
| (B): Average assets | 323888000 | 351002000 | 352755000 |
The ratios of Microsoft are hereby shown in the following table:
| Data | 2020 | 2021 | 2022 |
| EBIT | 52959000 | 69916000 | 83383000 |
| Average assets | 301311000 | 333779000 | 364840000 |
| Operating revenue | 143015000 | 168088000 | 198270000 |
| Ratios: | 2020 | 2021 | 2022 |
| EBIT / Average assets (A/B) | 0.1758 | 0.2095 | 0.2285 |
| (A): EBIT | 52959000 | 69916000 | 83383000 |
| (B): Average assets | 301311000 | 333779000 | 364840000 |
| EBIT/ Operating revenue (A/B) | 0.3703 | 0.4159 | 0.4206 |
| (A): EBIT | 52959000 | 69916000 | 83383000 |
| (B): Operating revenue | 143015000 | 168088000 | 198270000 |
| Operating revenue / Average assets (A/B) | 0.4746 | 0.5036 | 0.5434 |
| (A): Operating revenue | 143015000 | 168088000 | 198270000 |
| (B): Average assets | 301311000 | 333779000 | 364840000 |
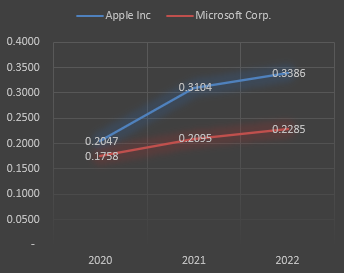
The trend line for EBIT/ Average assets are as follows:
The trend line for EBIT / Operating revenue are:

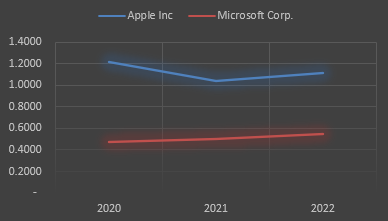
The trend line for operating revenue / average assets are:
As far as EBIT/ average assets ratio are concerned, Apple Inc has experienced an immense incline in 2022 with respect to the ratio experienced in 2020 as well as 2021. This vividly depicts that the company’s operating costshave decreased significantly in 2022. A notable aspect in this context is that as per the data,this has been the company’s highest EBIT in the past three years.
Contrastingly, the financial performance of Microsoft has been flatlined with slight inclination, since the company experienced a slight surge in its EBIT/ average asset ratio in 2022with respect to 2021. In consonance with the graphical depiction,it can be inferred that interms EBIT/ average assets, the financial performance of each organization seems comparative.

With the help of EBIT / operating revenue, the profitability pertinent with an organization can be ascertained in terms of its revenue. The following depiction illustrates thatthe profitability of Microsoft has been comparatively superlative to that of Apple Inc. in the past couple of years.
For instance, in 2020 EBIT / operating revenue of Apple Inc was 0.2047, which enhanced to0.3386within a span of two years. In contrast to that, the performance of Microsoft has been comparatively bettersince Microsoft’s EBIT/ operating revenue was 0.1758 in2020, which later on surged to 0.2095 in 2021 and 0.2285 in the consecutive year (Salehi, 2022).
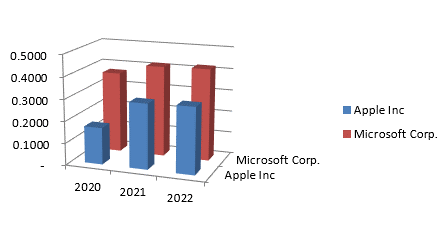
One of the noteworthy facets delineated in the aforementioned graphical expression, is its vivid illustration of profitability and its coherence at a proportionate magnitude to its respective operating revenue.
Grounded upon that,Microsoft’s performancecan be delineated as superlative to that of Apple Inc. over the course of the past three years cumulatively starting from 2020 onwards.
For the sake of gaining cognizance concerning the manner in which a firm integrates its assets in the due course of its business for generating revenue, the contribution of operating revenue / average assets ratio is unparalleled.
As far as efficacious utilization of organizational assets is concerned in order to streamline revenue, it is imperative to meticulously analyse both the firm’s performance.
From the aforenoted graphical demonstration, it can be comprehensively concurred that revenue as well as profitability of both Microsoft and Apple have undergone a bit of titillation to a certain extent in 2020.
However, from 2021 Microsoft reflects a steady inclination which is absolutely absent in case of Apple in the following years.
On one hand, performance of Microsoft enhanced in the respective years, the same of Apple deteriorated and ameliorated in 2022, thereby rendering a perfect fluctuation cumulatively. The ramification of the global pandemic is undeniable in case of both the organization’s financial performance.
However, Microsoft caught the drift of the subsequent revival, which is apparently missed by Apple Inc. in the same year of 2021. However, Apple Inc soon followed the uptrend in 2022 by navigating the challenging terrain of economic turmoil.
Later on, with the global acceptance of work from home culture, the business of both firms started to prosper seamlessly. As far as profitability and ROA are concerned, Microsoft’s performance is simply exemplary.
Also Read - Commerce Assignment Help
Recognition of revenue:
Revenue recognition is one of the most crucial aspects in accounting and financial reporting as it directly affects the financial picture of an organization. However; due to the inherent limitations of accounting standards there is no one single policy applicable to each and every organization for revenue recognition.
Hence; companies often follows different and suitable recognition criterions to recognize revenue in the financial statements. In this case also there is slight difference in accounting treatments between Apple Inc and Microsoft corp. when it comes to revenue recognition.
Apple Inc.:
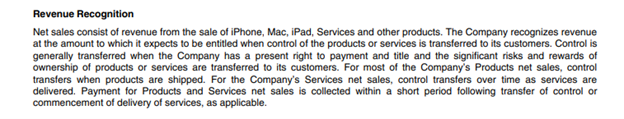
In case of Apple Inc. the company has clubbed all of its products sales together and recognizes revenue at expected amount at the time of transferring the control of the goods and services to the customers.
Hence; in case any changes in the actual revenue due to changes in the price in case the actual sales happen after or before the transfer of control on the goods and services is not recognized. The extract of the revenue recognition principle used in apple Inc. is provided below.
Microsoft Corp :
Revenue recognition in case of Microsoft Corp. is even though very similar in nature as the company again recognizes the revenue at the expected price when the products or services are transferred to the customers.
However; the slight difference in accounting treatment is at the contract level where the company keeps a provision of various combinations in the contract to provide for changes in the revenue amount and subsequent modification in the amount of revenue in case necessary after the sales.
The extract from the accounting notes of revenue recognition of the company is provided below for better understanding.

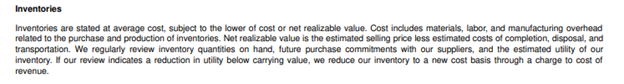
Inventory valuation:
IFRS 2 allows companies to value their inventories any one of the given valuation methods. First in first out (FIFO), average costing and weighted average costing are various alternatives which are allowed in the standard and accordingly companies can opt for any one of the given valuations models.
Apple Inc. has used FIFO method to value its inventories and accordingly, the value of the inventories showed in its financial statements has been derived using FIFO method as can be seen from the accounting notes extract provided below.

Unlike Apple Inc. inventories of Microsoft Corporation has been valued at lower of average cost and net realizable value as provided in IFRS 2.
The extract from the financial statements in the annual report of the company is provided below to understand the clear difference between the accounting treatments of the two companies in valuing their inventories.
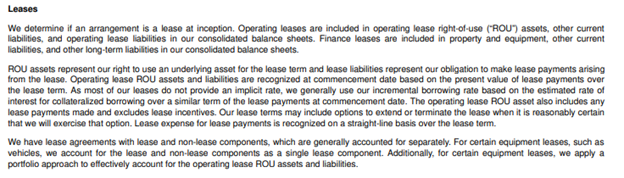
Accounting for leases:
Another accounting treatment difference between the two companies is accounting for leases. Microsoft Corp. determines the nature of lease at the beginning or inception of the lease and accordingly classifies leases as either operating lease or finance lease and accordingly, the accounting treatment is carried out.
The detailed of accounting treatment for lease of the company is stated below in the form of extract taken out from the company’s annual report.
Apple Inc. on the other hand combines lease and non-lease agreements as a component of a single lease. Thus, the company clearly differs from the accounting treatment for leases as stated in IFRS 16. Extract of the accounting note for leases of Apple Inc. is given below.

Also Read - Accounting Assignment Help
Apparently, it would seem that the contribution of accounting information is invaluable when it comes to intricately evaluating a firm's financial health. However, it has its fair share of shortcomings associated with it in encompassing the full-fledged scope of approaches undertaken by companies such as Apple Inc. and Microsoft to inculcate their resources to generate value.
Accounting typically concentrates upon historical financial data, substantiating a retrospective perspective that does not adequately resonate the dynamic nature of tech firms. Intangible assets, like brand value, capabilities to integrate innovation, and customer loyalty, are not ascertained fully on the balance sheet, thereby affecting the evaluating process and essence of the company's true worth.
For tech firms heavily investing in the realm of research and development, and its respective potential long-term benefits isnot scrutinized by prevalent accounting practices (Barth et al., 2023). Consequently, decision-makers should complement accounting information with a broader cognizance of industry trendsand strategic initiatives for ascertaining a more comprehensive evaluation of value generation.
Application Of Blockchain In The Financial Sectors |
Analysis Of Financial Reporting Practices Of FMG |
Activity-Based Supplier Costing and its Implications for Identifying True supplier Costs |
Barth, M. E., Li, K., & McClure, C. G. (2023). Evolution in value relevance of accounting information. The Accounting Review, 98(1), 1-28.
Salehi, A. K. (2022). Critical review of the role of accounting in the decision-making process. Journal of Islamic Accounting and Business Research.
Sarwar, M. I., Iqbal, M. W., Alyas, T., Namoun, A., Alrehaili, A., Tufail, A., & Tabassum, N. (2021). Data vaults for blockchain-empowered accounting information systems. IEEE Access, 9, 117306-117324.
SUZAN, L., SUDRAJAT, J., & DAUD, Z. M. (2020). Accounting information systems as a critical success factor for increased quality of accounting information. RevistaEspacios, 41(15).
Are you confident that you will achieve the grade? Our best Expert will help you improve your grade
Order Now


Subscribe to avail our special offers
Disclaimer: The reference papers given by DigiAssignmentHelp.com serve as model papers for students and are not to be presented as it is.
These papers are intended to be used for reference & research purposes only.
Copyright © 2026 DigiAssignmentHelp.com.
All rights reserved.
Powered by Vide Technologies
100% Secure Payment